Top 10 most popular Works
I promised to illustrate an example of a Talis Decisions report on the top 10 most popular works. Here are a couple of ways of doing it. I am indebted to Sharon Jamieson of Aberdeenshire Library and Information Service (ALIS) for the second of these; the ALIS example uses Talis Decisions XI version 3. Both examples use the Circulation Universe.
Example 1 – Simple example based on the current version of Talis Decisions
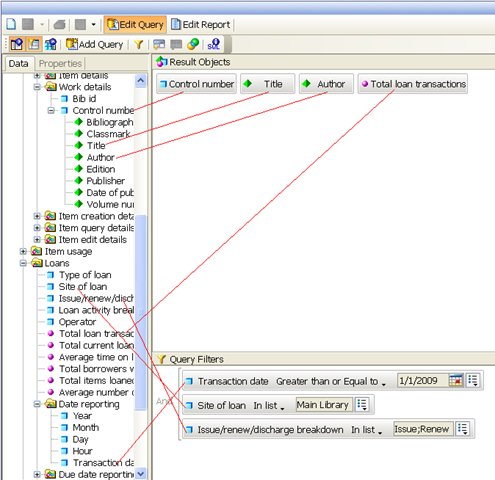 This example has been pared to the minimum: the queries are hard coded (you could use prompts) and item types plus Dewey have been ignored. This is the query showing where the objects are found in the Universe:
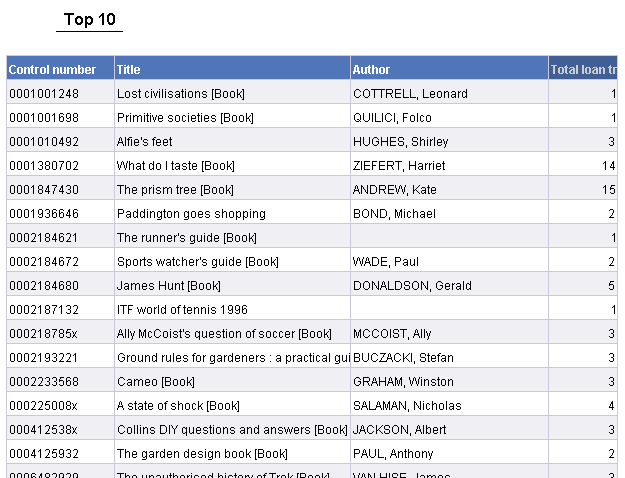 The default report is used as the basis (all that has happened here is that I have tidied up the heading and the column widths):
The default report contains all the loan records: i.e. no ranking. You can use the Ranking option as described in the second example. An alternative approach (used for illustration) is to create a Ranking variable and use that. The steps are as follows
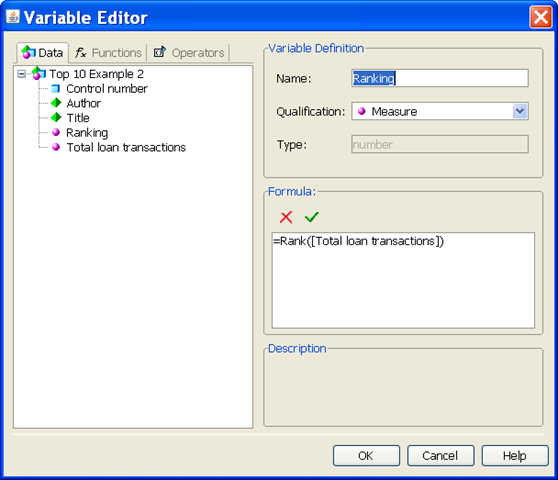 Create a variable. You can call it anything that you like: I called mine Ranking. Set the variable equal to =Rank([Total loan transactions]).
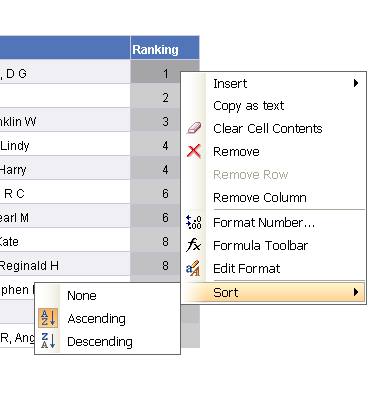 Add this variable to the table, sort on it…
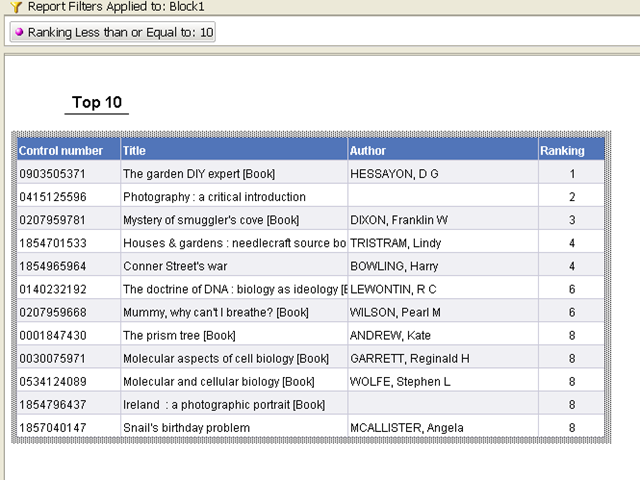 … and finally add a filter to the table to display only those records where the ranking is less than or equal to 10.
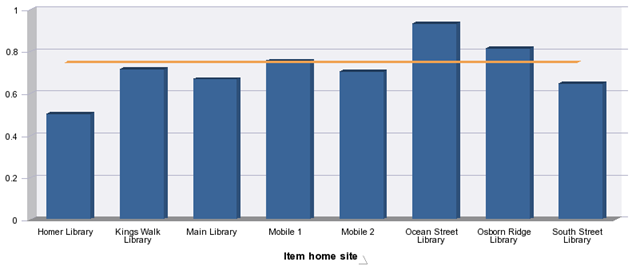
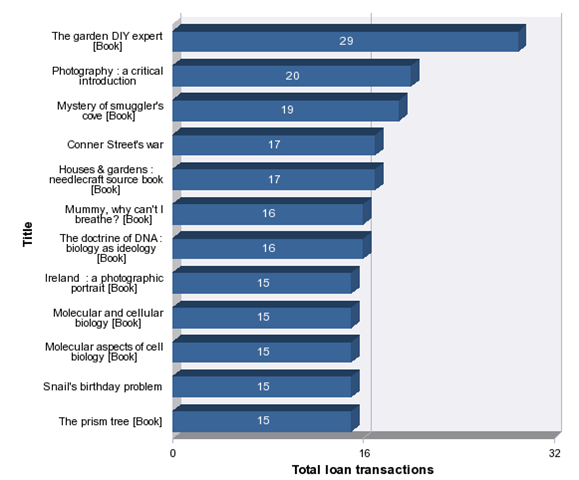 It is possible to produce the same data in graphical form, although the detail of this is probably a bridge too far if this post is to be kept within reasonable bounds.
Example 2 – from ALIS (Talis Decisions XI 3)
The ALIS example uses the same basic approach but adds more data and uses a more sophisticated way of reporting the results for different Item types

Here is the basic query (click on it for a larger view). The Results Objects (top right) are
- Item Types
- Control Number
- Author {Control Number Detail}
- Title {Control Number Detail}
- Item Class mark (Dewey) {from Item Conditions}
- Total Loan Transactions
The Query Filters (bottom right) are Issue/Renew/Discharge breakdown In List Issue:Renew , Transaction Date Greater than or equal to {Prompt} and Site of Loan In List {Prompt}
There are actually four reports (each with its own tab) in the document:
- A Main report containing everything
- Top 10 Books
- Top 10 DVDs
- Top 10 Talking books
Clearly the exact subdivision will vary according to local preferences.
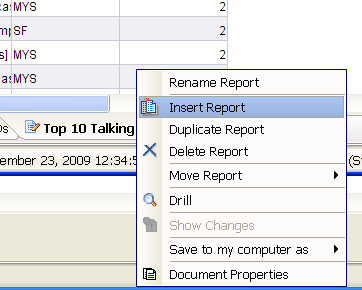
Running the query will add a default report (tab). You can add additional reports by right-clicking an existing one and choosing "Insert Report”:
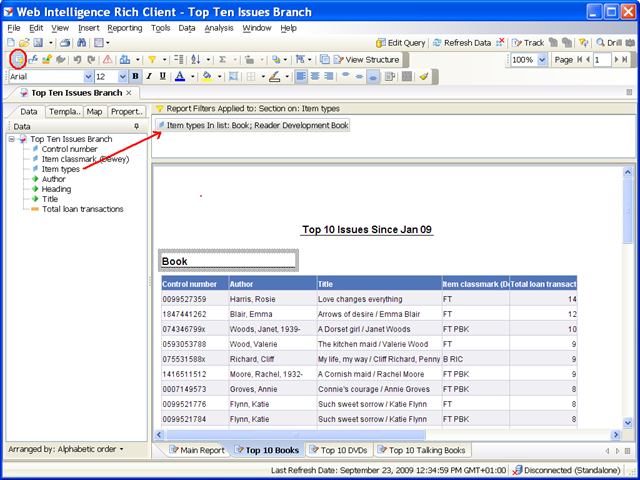 Each report, (or a section within the report – authors choice) has a filter. This is accessed by clicking on the filter button (red ring), selecting the block or section you want to filter and dragging the data item that you want to filter on into the filter area (red arrow).
NB – this is different from the query filter. In Talis Decisions you can filter both in the query (this limits the scope of the raw data available to the report) and on elements in the report itself (which limits the data actually displayed on the selected block – table, section or report tab).1
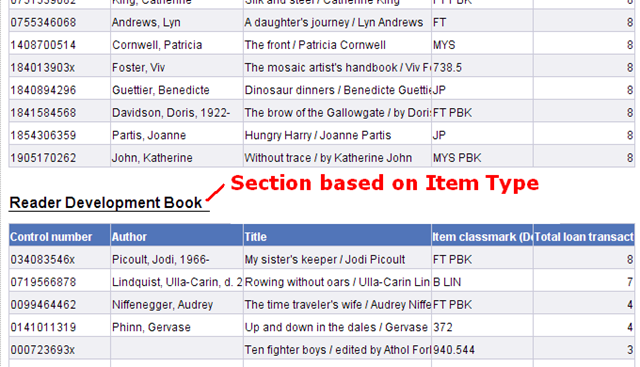
In the ALIS example, each of the “Top 10” report tabs has several sections based on Item Type: so for example the Top 10 Books tab has a section on Item Types with a filter on the section limiting the Item Type to Book or Reader Development Book. The result is that there are two tables on this report tab – one for Book and one for Reader Development Book on this tab
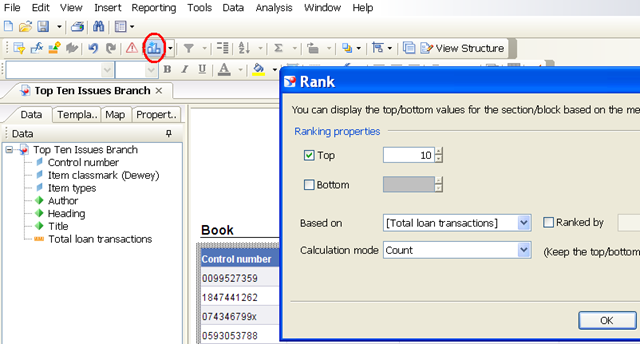
The report so far will not have just the top 10 in it, but all records. In the latest version of Talis Decisions, you can select a table and use the Rank dialogue to limit the results returned just to the top 10.
Beware!
There are two potential traps with both examples. The first relates to the size of the query. For this report to run in a reasonable length of time, the (Loan) Transaction Date should be included in the query filter and must not be set too long in the past. If in a large library you attempted to run this report over (say) five years, it would probably run for a very long time. If limiting the date does not have any apparent effect on the time that the query takes to run, then there is probably an issue with your Talis Decisions installation (such as a missing index): you may wish to contact Talis for more help.
The second issue relates to accidentally excluding data. In the first example, the inclusion of Item Class mark from the Item Conditions class in the query will limit the data returned to items that have a Class mark. If an item doesn’t have this, it will not appear in the results. This may not be an issue for you but can be a problem if your data are incomplete.
Note too that ALIS reported an obscure anomaly with timeouts in the software. This may not be general, but their experience was that the query as described ran with no problems in either Desktop Intelligence (Deski) or Web Intelligence Rich Client: but if using Web Intelligence within Infoview the query timed out if the Ranking was used with the Site of Loan in the Query filter. It was OK with either one, but not both.
This is a long post, but even then can’t substitute for formal training materials. Please do let us know (by commenting on this blog, or e-mailing me) whether it was useful. For more information on how to use Talis Decisions, see the Training and Videos pages of the website. The Videos page for example has a 5 minute introduction to filters.


Recent Comments