Dashboarding in Decisions
One issue that comes up from time to time in the context of Decisions is Dashboards. “Dashboard” means different things to different people, but the core is typically a collection of graphical reports designed to give a specific user an at-a-glance overview of performance or outcomes in areas that are of interest to them.
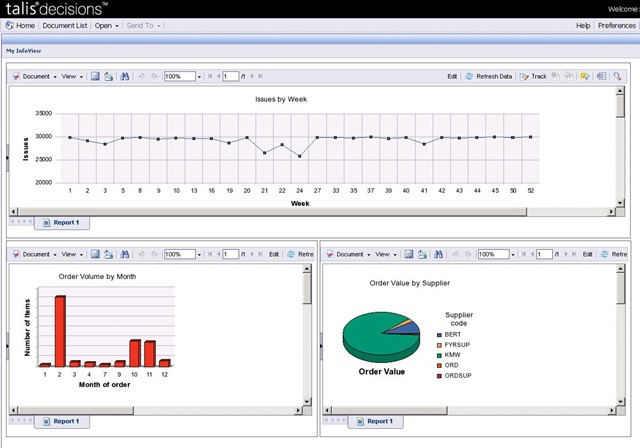 Decisions is not primarily a tool for constructing dashboards, but it is certainly possible to put together simple dashboards for specific users. Here is an example intended for a hypothetical acquisitions manager. Dashboards in Decisions are constructed using the “My Infoview” option. This permits the user to specify a number of panels (this example shows three) in almost any rectilinear combination of size and position.
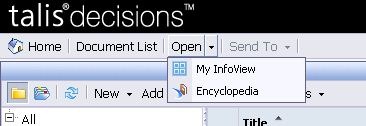 “My Infoview” is accessed from the menu toolbar (this example is from XI R3.1). It is possible to set up a user’s preferences so that they go to their “My Infoview” page by default when they log in. There are many options but the example shown was created using the following settings:
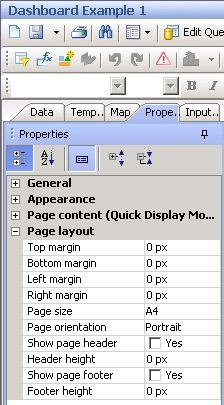 The Properties of the report pages were set so that the report margins were zero and the headers and footers suppressed. The graphs and charts were sized to fit the space available and positioned at the top left of the page .
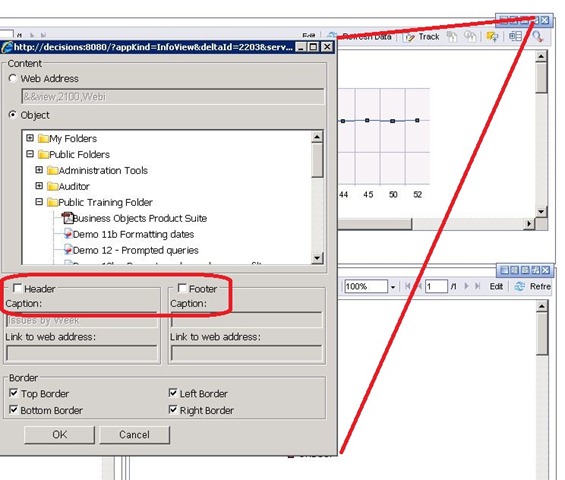 Also the properties of the “My Infoview” report panels were amended to suppress the headings and headings were added to the chart: this is however purely a matter of preference
Not everyone has a need for a dashboard, but dashboards can be helpful, and the facilities in Decisions are quite adequate for most users.

Recent Comments