Decisions Blog

Archive for August, 2011

Reporting Fines and Charges in Decisions – take 2

Yesterday I posted in example of reporting fines and charges together. Today I’d like to do an example of another issue that folk struggle with in this area: reporting the loan data associated with charges or payments.

The problem

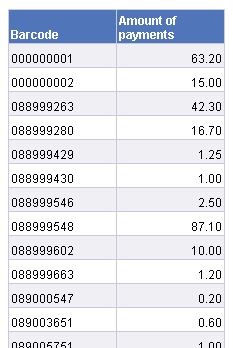
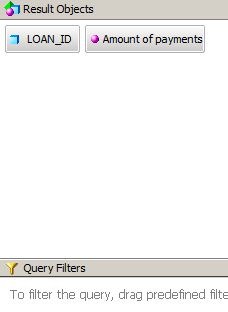
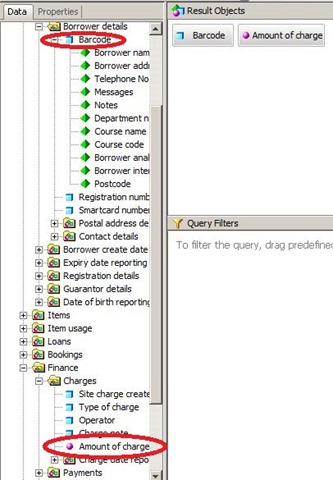
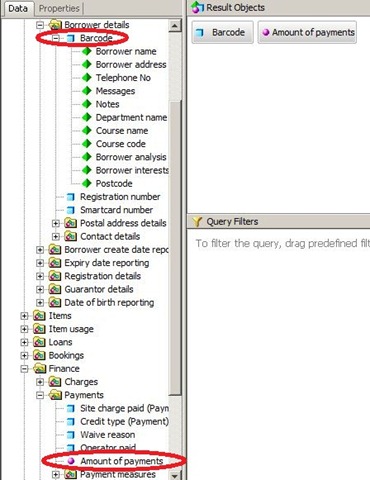
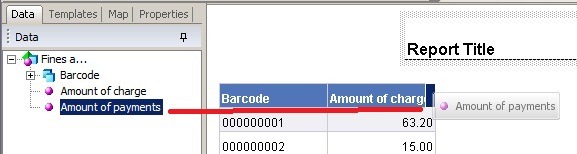
Suppose you have a list of payments similar to the one in yesterday’s blog post (query on the left, results on the right):

2 Fines 4

2 Fines 5 

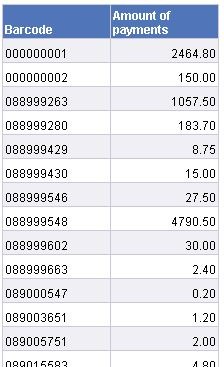
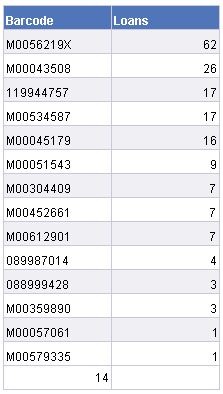
Now merely drag in the Item type and refresh. This returns wildly spurious results, and to add insult to injury takes a long time to run:

2 Fines 6

2 Fines 7

2 Fines 3 
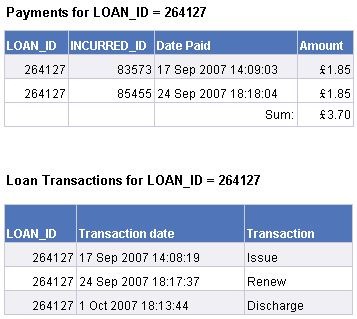
The reasons for this are complex but part of the issue is that payments and the items related to those payments are not straightforward. Alto must store its data so that it can handle part payments, reservation charges, hire charges, fines, payments that are waived: even payments that are unrelated to a loan at all. Here for example are two lists for a single loan (a loan of a given item to a given borrower, identified by LOAN_ID). We can surmise that this was a hire item with a hire charge of £1.85. There is more discussion of this in this forum post.

A solution

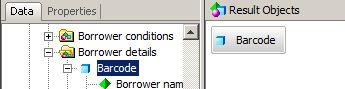
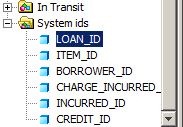
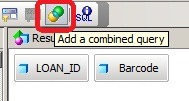
The key to handling this area is to use queries linked on LOAN_ID. Suppose that we want to list fines or hire charges by loan type and location and include the borrower barcode so we can easily cross-check against Alto.

First we need to be clear about what exactly we mean by “location”. Do we mean the location where the item was issued or discharged, or where the payment was made? What if (to take an extreme example) a hire item was renewed three times at different locations and payment taken as a mixture of transfers from credit and part payments – and some of the charges were waived? The answer is likely to depend upon the use to which the information will be put. If it is about planning location of tills, presumably location of the payment is critical. If it is about circulation, then the location of the original issue may be significant. We have assumed the latter in this example.

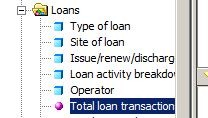
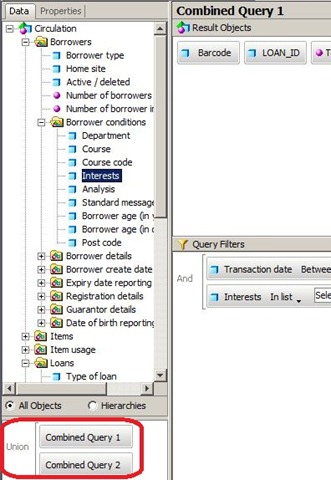
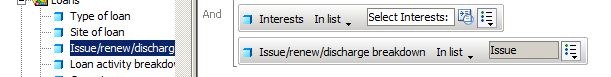
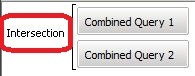
The type of charge (Fine, hire charge etc) is related to the charge so if we want to restrict our charges to a particular type, we will have to get the charges too. So in this example we have three queries. All three contain LOAN_ID which is what we will use to link them together in the report.

2 Fines 8 2 Fines 9 2 Fines 10

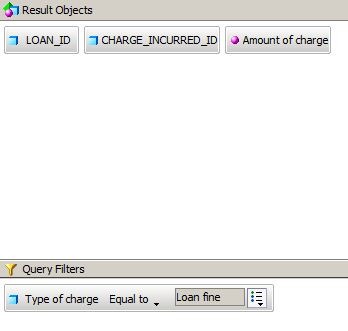
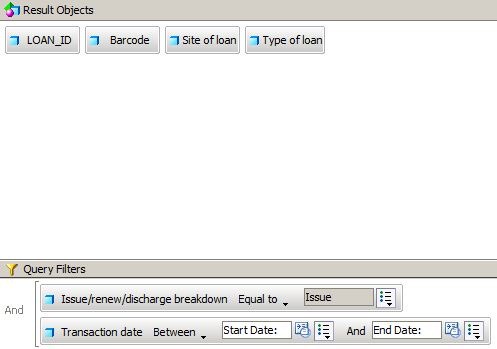
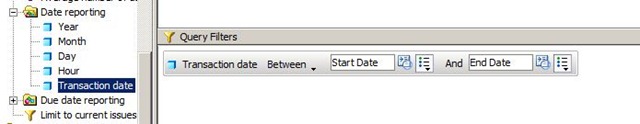
Note that the charge query is filtered to return just Loan Fines, and the Loan query has a filter on date range. The latter is critical if the query is going to return fairly quickly. The loans are also limited to Issues. This means that the “site” will be the one where the item was issued.

2 Fines 11

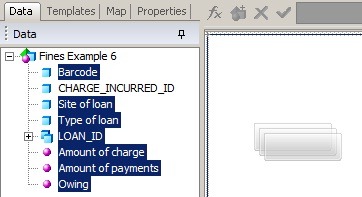
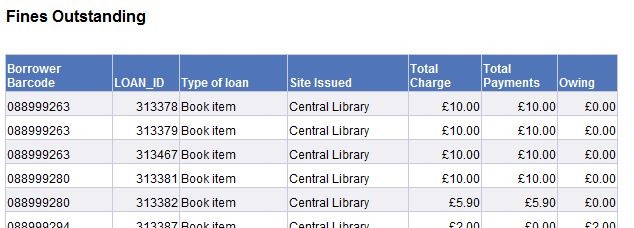
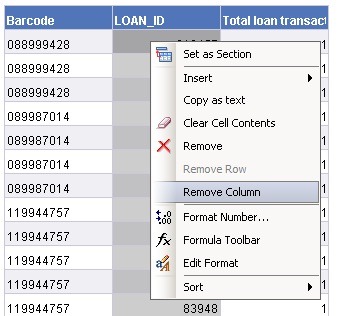
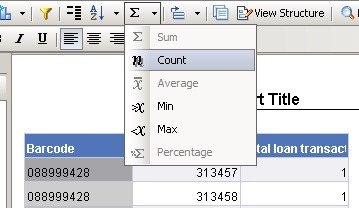
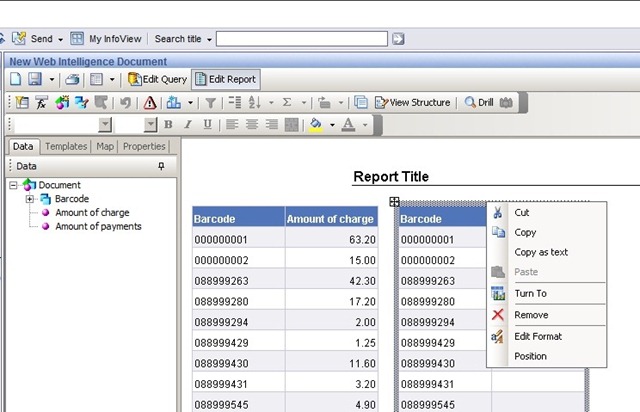
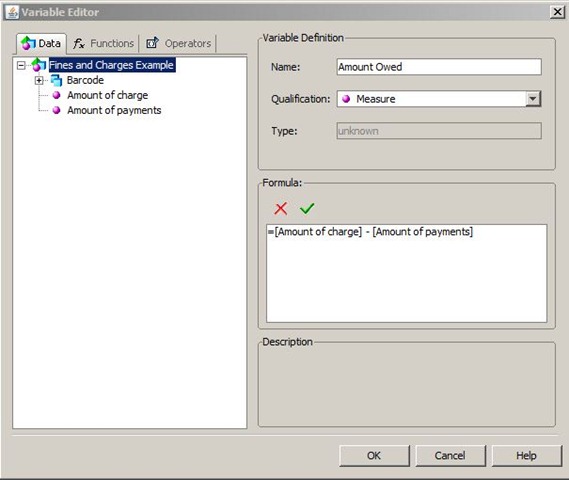
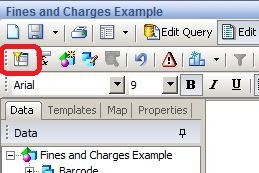
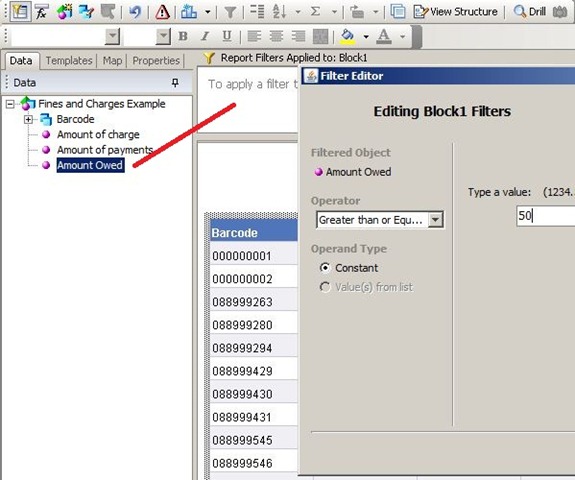
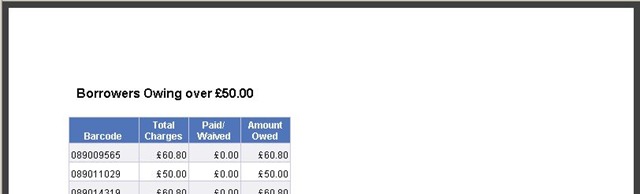
Having refreshed these queries, you will have the usual default reports. As in the previous example you can delete the report tabs and start again. As before I created an “Owing” variable. To create the report, drag everything except the CHARGE_INCURRED_ID into an empty report tab. Select the table and place a report filter of “Amount of Charge > 0” on it. This ensures that only charges for the selected Charge Type (loan fine in this case) are displayed. After the usual formatting, the final result looked like this:

2 Fines 12

Summer Reading Challenge

One Decisions report I’ve been asked about is how you report loans that have been completed from start to finish within a certain period of time. This is relevant to the Summer Reading Challenge in public libraries where participants are “challenged” to read 6 books between two dates.

The problem

Listing the number of issues that a borrower has had in a date range is easy. Listing the number of discharges is also easy; but what we want is to count loans where the issue and the discharge both occur in the date range: i.e. we want to ignore any discharges without a corresponding issue and vice versa.

The solution

There are several ways we could tackle this. One is to take advantage of the fact that Alto uses a unique LOAN_ID for each loan, and use a “combined query” in Decisions. For this example, I’m assuming that participants in the Summer Reading Challenge in a particular year are identified by a particular interest code. If this is so, the procedure is as follows:

Create a query with the following data in it:

  • Borrower Barcode
  • LOAN_ID. This is at the bottom of the tree structure of objects in the universe:
  • Total Loan transactions

SRC1

SRC2

SRC2a

NB: it is vital to limit the date range on the loans. Here I’ve add start and end date prompts which make the report re-usable – you can change the dates any time you refresh it

SRC4

Ad a query filter on the Interest code (or other identifier of participating borrowers)

Now click on the Combined query icon in the toolbar. This creates two queries out of the original one with the same data in both. You can select which one you want to look at in the bottom left pane.

SRC3

SRC5

Combined queries must return the same data items but can have different filters: indeed you will have to add the date and Interest filters back into Combined Query 2. Ideally use exactly the same text (including spaces, capitalisation and punctuation. Decisions will the combine the two prompts)

Here comes the clever bit

  • In Combined Query 1, add a Query Filter to restrict the rows returned to just the issues
  • In Combined Query 2, add a Query Filter to restrict the rows returned to just the discharges
  • Double click the word “Union” on the left of the Combined Query box until it reads “Intersection”.

SRC7

SRC6 Now refresh the report. What Decisions does under the bonnet is go away and get a list of all the issues in the period for Borrowers with the selected interest code. It then gets a second list of all discharges in the period for Borrowers with the selected interest code. But it displays only those Borrowers and Loan ID combinations that are in both lists. In other words if the one query returns a Borrower barcode/LOAN_ID but the other one doesn’t, it isn’t displayed.

SRC8 After the refresh you will get a default report with a table in it. This contains all the barcode/LOAN_ID combinations  as described above along with a column of transaction counts. The latter will be a bit dull, being uniformly “1”. Delete the LOAN_ID column (right click and select “Remove Column”). This will leave you with a list of barcodes. The “Total loan transactions” column should adjust itself to the total for each barcode. As described in the post on fines, you can add a filter to the table and limit the data displayed to whatever value you like (e.g. 6 or more for the Summer Reading Challenge. As before, select the table before adding the filter)

SRC9 If your interest is primarily the total number of qualifying borrowers rather than the detail, you can right-click the barcode column and select Count in the maths drop down  to get a total at the bottom of the table.

You can tidy the report up further by tidying up headings and column widths. In this example, I have also sorted the table on descending number of loans. This is done by right-clicking the column you want to sort on and selecting the sort option. The end result looks something like this:

SRC10

You can add further report filters to remove known exceptions. For example the top barcode in this list might be a dummy used for outgoing ILLs that had been mistakenly coded with a Summer Reading Challenge Interest Code.

If you are a Capita Libraries customer, you can download a zipped BIAR file below containing a sample report. If you download it and try it, please do let me know how you get on with it. If you would like it but cannot download it, drop me an email.

2011_09_05_SRC.zip (log in required)

Reporting Fines and Charges in Decisions

The reporting of fines and charges in Decisions can be unexpectedly difficult. This post tries to explain why and gives a simple example of a fines/charges report that can be extended/adapted to suit local needs. The main issue that can cause confusion  is the way that databases handle joining two lists of data together.

The problem

If you ask most databases or information system to join two lists and present you with the results, the system has a choice to make. Did you want:

  • All of both lists?
  • Only those items that appear in both lists?

For example if you have a list of borrowers and a list of books and you ask for a list of which borrowers have borrowed which books, do you want to include all the inactive borrowers and all the books that were not loaned at all? These sorts of questions are often (but not always) obvious to a human but aren’t obvious to a computer. Sometimes they aren’t obvious even to a person: for example if you ask for a list of books by format, what about those that aren’t classified by format at all?

None of this is a problem if you just want a list of charges incurred by borrowers, or just want a list of their payments. The problem comes when you want a list of what each borrower owes, because that is logically all their charges minus all their credits (paid/waived). If you compose a single query in Decisions to get a list of borrowers, their charges and their credits you are in effect asking for a combined list and (unlike a human observer) the database cannot figure out from the context that you will want all the borrowers with charges regardless of payments. In this case unfortunately it will assume that you only want data where there are both charges and payments and the results will not be at all what you want.

The solution

Fortunately the solution is fairly straightforward: ask Decisions to get the two lists separately and then combine them in Decisions. Here is a simple example which lists all borrowers who owe more than £50.00. The logic is exactly the same as that described by Brian in this forum post.

The Queries

Ask Decisions to get all the charges by barcode using the Circulation Universe in one query and then all the payments in a second query:

Fines 1

Fines 2

The report

When you refresh these queries, Decisions will go and get the two lists and will display them side by side in two tables in a default report. You can delete that report tab if you wish and start again, or do as I have started to do here and delete one of the tables (right click the edge of the table and select “remove”)

Fines 3

Note in the data pane on the left that Decisions has recognised that “Barcode” is a common data item and has merged it (notice the “+” alongside it). Having deleted the table listing the payments, drag and drop the “Amount of Payments into the first table:

Fines 4

[if you aren’t used to doing this, note that you are looking for the small dark blue vertical rectangle at the edge of the cell labelled “Amount of Charge”). If the whole cell heading is highlighted you will just over-write the amount of charge rather than adding a new column]

You will now have a list of total charges and total payments for each barcode. At this point you can if you wish save it as Excel and take it from there, but if you would like to finish the job in Decisions to save having to redo the Excel manipulation every time, here is how:

Amount Outstanding

In Decisions you can create variables that are built on existing data. There are a  couple of short videos explaining variable on the Decisions website. In this example, we create a variable for the amount owed by making it equal to the amount of charge minus the amount paid:

Fines 5

Drag this new variable into the table in exactly the same way that you did the amount of payment

Limiting to Borrowers owing over a given amount

If you would like to limit your list to Borrowers owing over an certain amount (say £50.00) then you can use a filter on the table (this is different to filtering the query). The steps are as follows:

Fines 6

  • Click on the Show/Hide Filter Pane button
  • Select the table (a selected table has a thick grey border). Don’t omit this step.
  • Drag the “Amount Owed” variable into the filter pane
  • In the pop-up that is displayed, select  “greater than” or “greater than or equal to” and enter “50” of whatever your chosen limit is and click OK.


Fines 7

Tidying Up

If you would like to distribute the report routinely it may be worth tidying it up visually. You can for example

  • Format the Currency columns
  • Resize columns
  • Amend Column heading text, centre it, set word wrap on etc
  • Add a Title
  • Reposition the table

Fines 9

Technorati Tags: ,,,